Description of the network diagram software that used in the project


Microsoft Visio

Description: Microsoft Visio is a diagramming tool in the Microsoft Office family. It is used to create a variety of diagrams, including flowcharts, organizational charts, and network diagrams. Visio provides a wide range of templates and shapes specifically designed for network diagrams, making it an ideal tool for visualizing complex network structures.

Features:

  • Extensive library of shapes and stencils tailored for network diagrams.
  • Integration with other Microsoft Office products.
  • Support for various file formats for easy sharing and collaboration.
  • Customizable templates to fit specific project needs.
  • Real-time collaboration features.
  • Easy-to-use interface with drag-and-drop functionality.

Steps to Create Network Diagrams Using Microsoft Visio

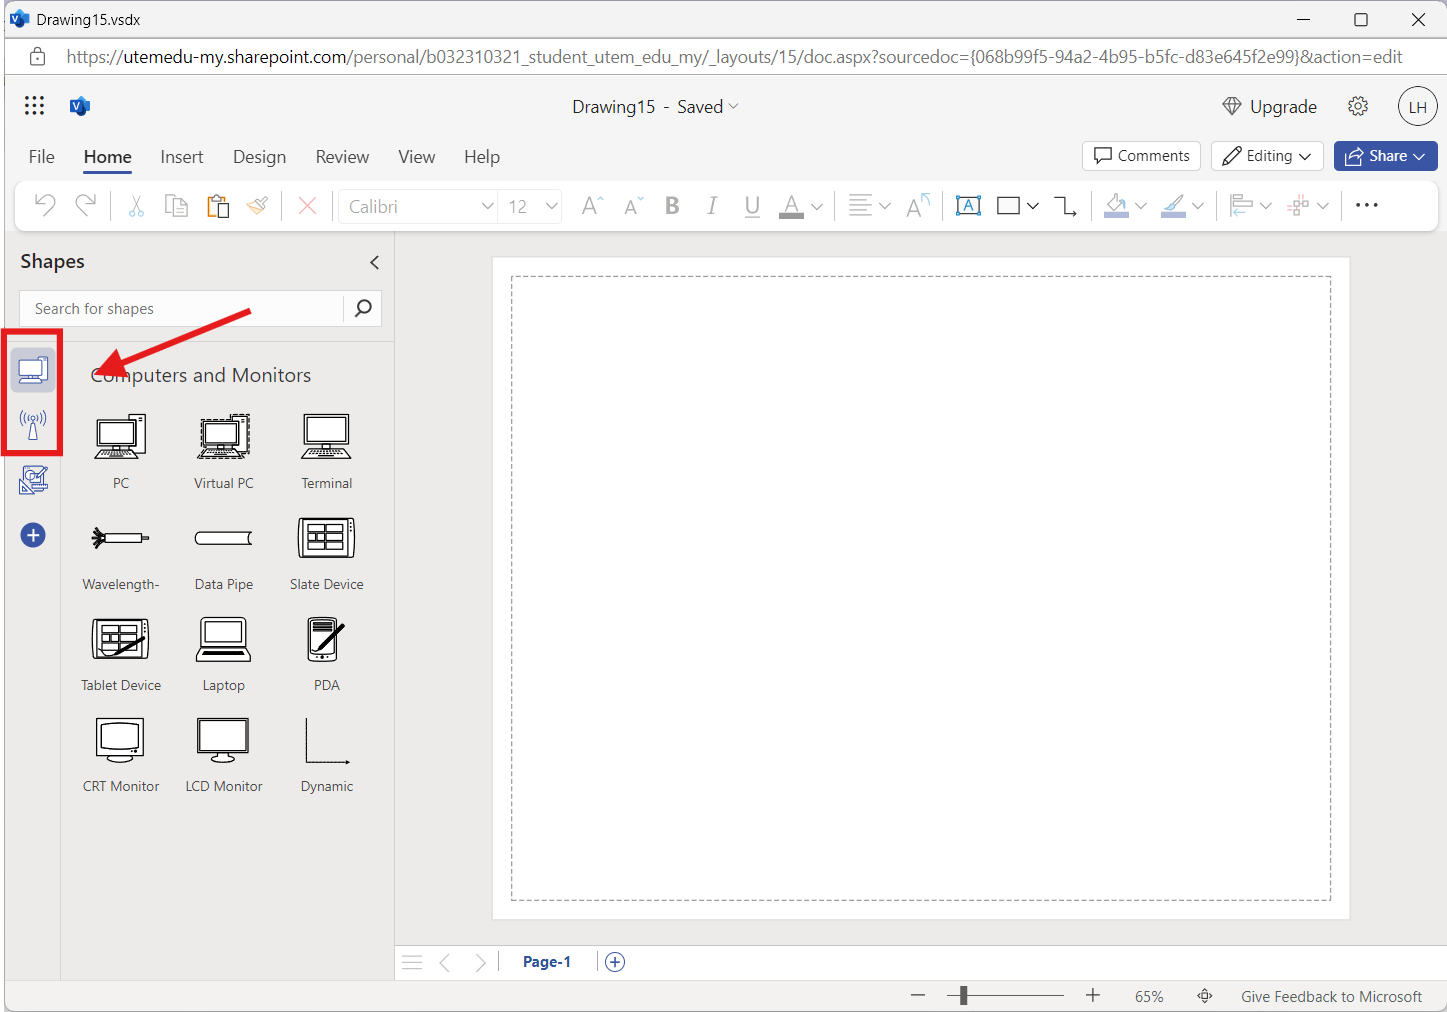
Step 1: Selecting the Network Diagram Template

  • Open Microsoft Visio:

    • Launch Microsoft Visio from the Start Menu or desktop shortcut.
  • Choose a Template:
    • On the Visio home screen, go to "All Templates".
    • Choose a relevant template such as a "Basic Network Diagram" 

Step 2: Adding Network Shapes

  • Access Network Shapes:
    • On the left sidebar, under "Shapes," you will find various network-related stencils. These include shapes for computers, servers, routers, switches, and more.
  • Drag and Drop Shapes:
    • Drag the necessary shapes onto the drawing canvas to represent different network components.
    • Arrange the shapes to mirror the actual physical or logical layout of your network.

Step 3: Connecting the Shapes

  • Access the Connector Tool: On the toolbar, select the connector tool or simply use the "Line" tool to create connections between shapes.


  • Create Connections: Click on a connection point on one shape and drag the connector to the connection point on another shape. This represents the physical or logical connections between network components.

Step 4: Customizing and Labeling the Diagram

  • Add Labels: Double-click on any shape to add a label. For example, you can label a shape as "Server1" or "Main Router" to identify different components.

  • Customize Appearance: Use the formatting options to change the color, size, and style of the shapes and connectors to enhance the readability of your diagram.

Step 5: Finalizing and Saving the Diagram

  • Review the Diagram: Ensure all necessary components are included and correctly connected. Check the labels and formatting for clarity and consistency.

                                        
  • Save the Diagram: Click on "File" in the menu bar, then select "Save As." Choose a location, enter a file name, and select the desired file format (e.g., .vsdx for Visio files, .pdf for a non-editable format).


Post a Comment

0 Comments